5 DoF Kinematic Calibration
Calibration of a 5 DoF surgical robot using an optical tracker and polynomial fitting. The worst single-axis position error on the test set fell from 8.58 mm to 0.30 mm.
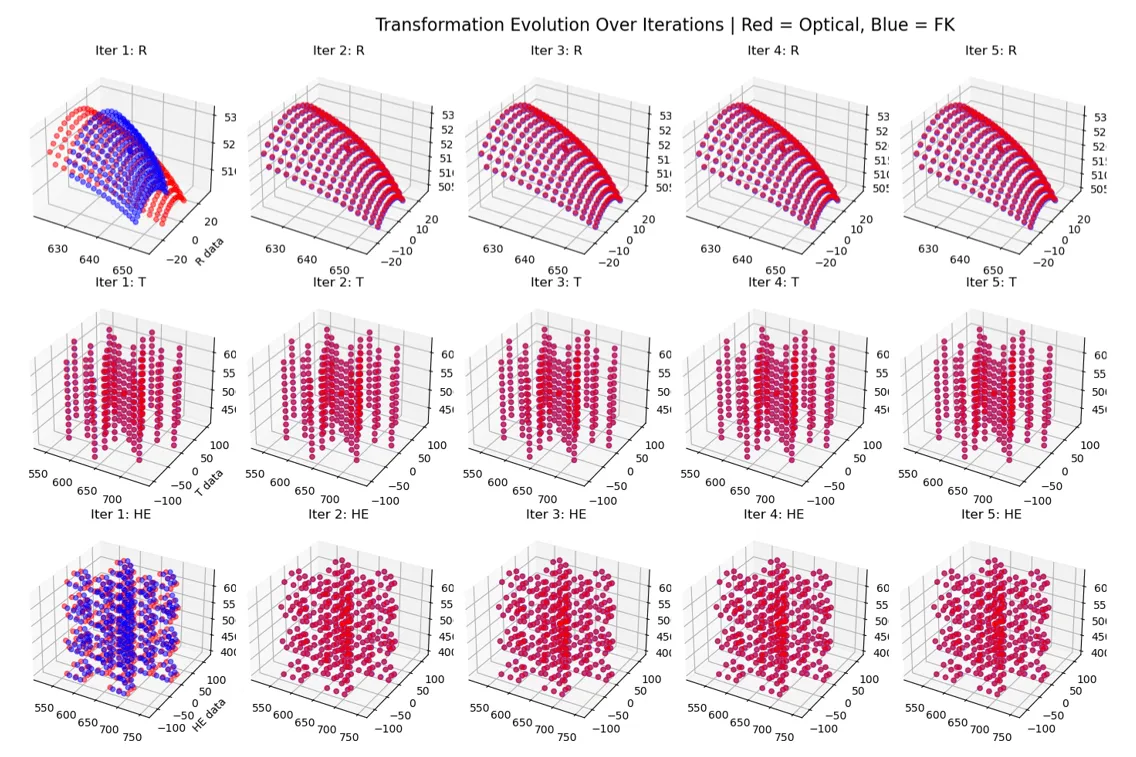
Approach
This was a two-month kinematic and hand-eye (HE) calibration. An Atracsys infrared optical tracker took the sensor readings, the robot’s internal forward kinematics (FK) supplied the other side of the comparison, and the calibration itself used polynomial fitting.
What makes a 5 DoF delta-plus-rotation robot unusual is that translation and rotation can be separated, so I calibrated them separately.
Results
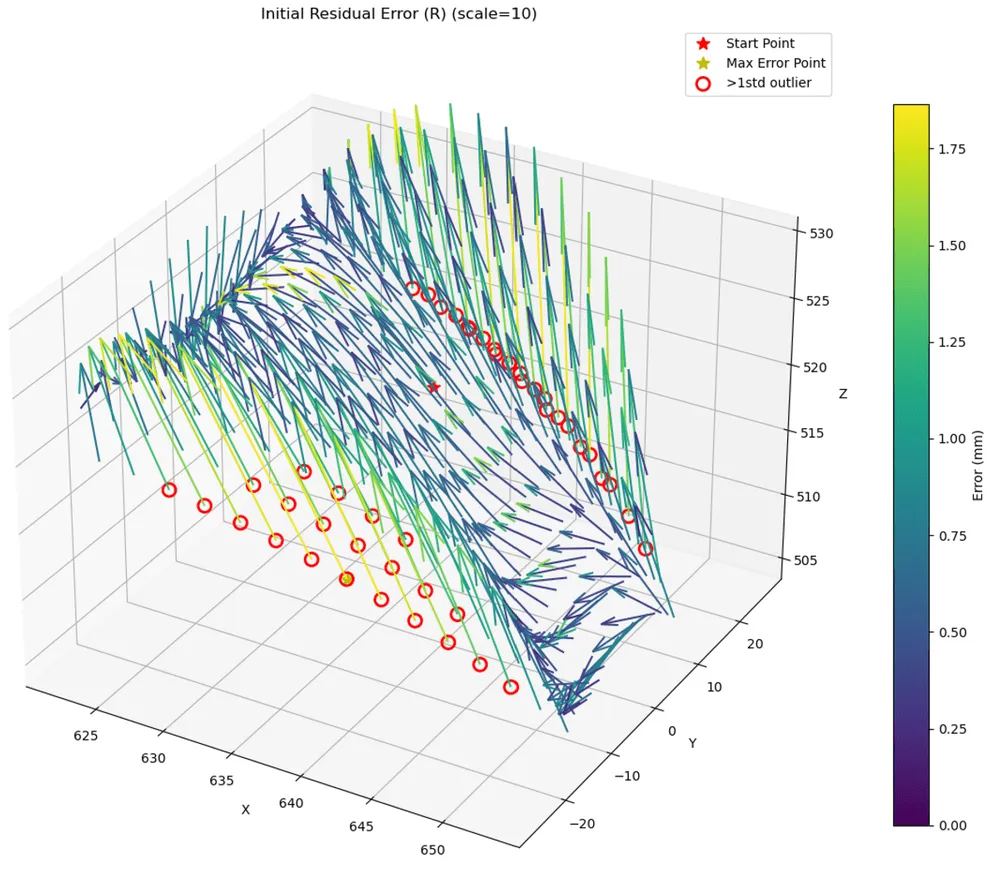
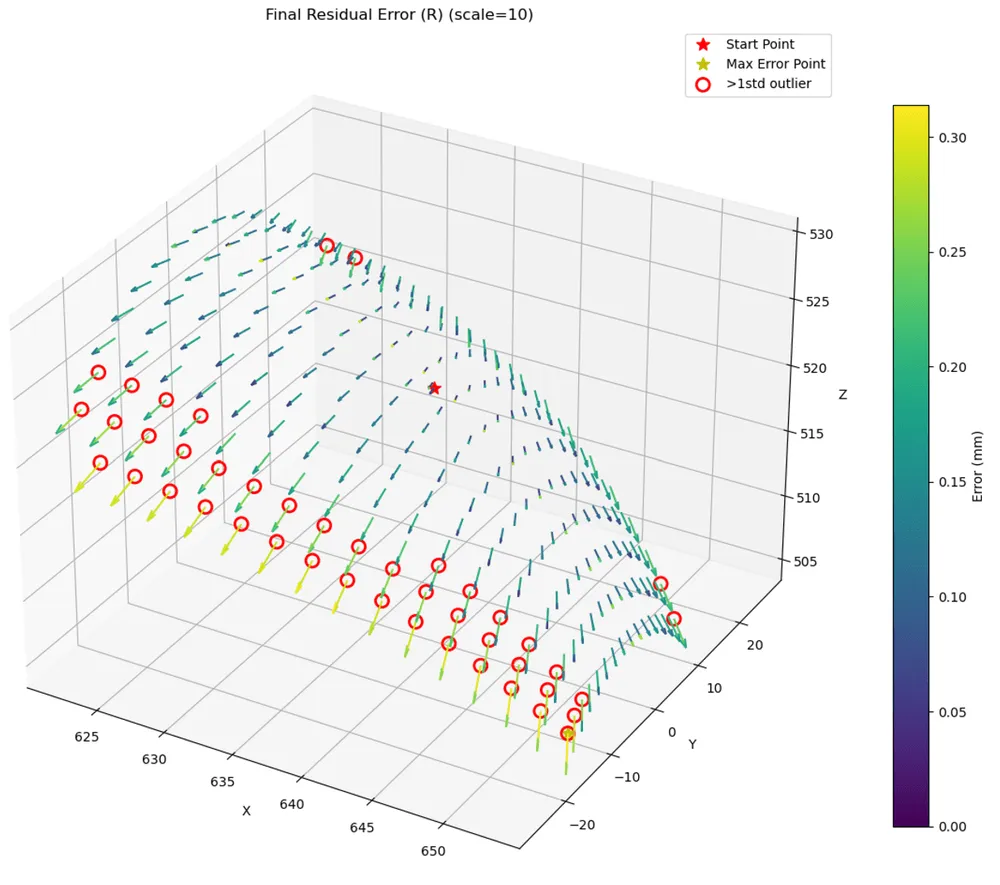
On the test HE data set, mean position error fell from 4.80, 2.61 and 0.76 mm to 0.08, 0.12 and 0.16 mm in X, Y and Z. The largest single-axis error fell from 8.58 mm to 0.30 mm.
Position error (mm)
| Data set | State | Mean X | Mean Y | Mean Z | Std X | Std Y | Std Z | Max X | Max Y | Max Z |
|---|---|---|---|---|---|---|---|---|---|---|
| Test HE | Uncalibrated | 4.803 | 2.613 | 0.755 | 3.167 | 1.654 | 0.536 | 8.576 | 5.084 | 2.126 |
| Test HE | Calibrated | 0.077 | 0.116 | 0.155 | 0.056 | 0.078 | 0.077 | 0.238 | 0.282 | 0.302 |
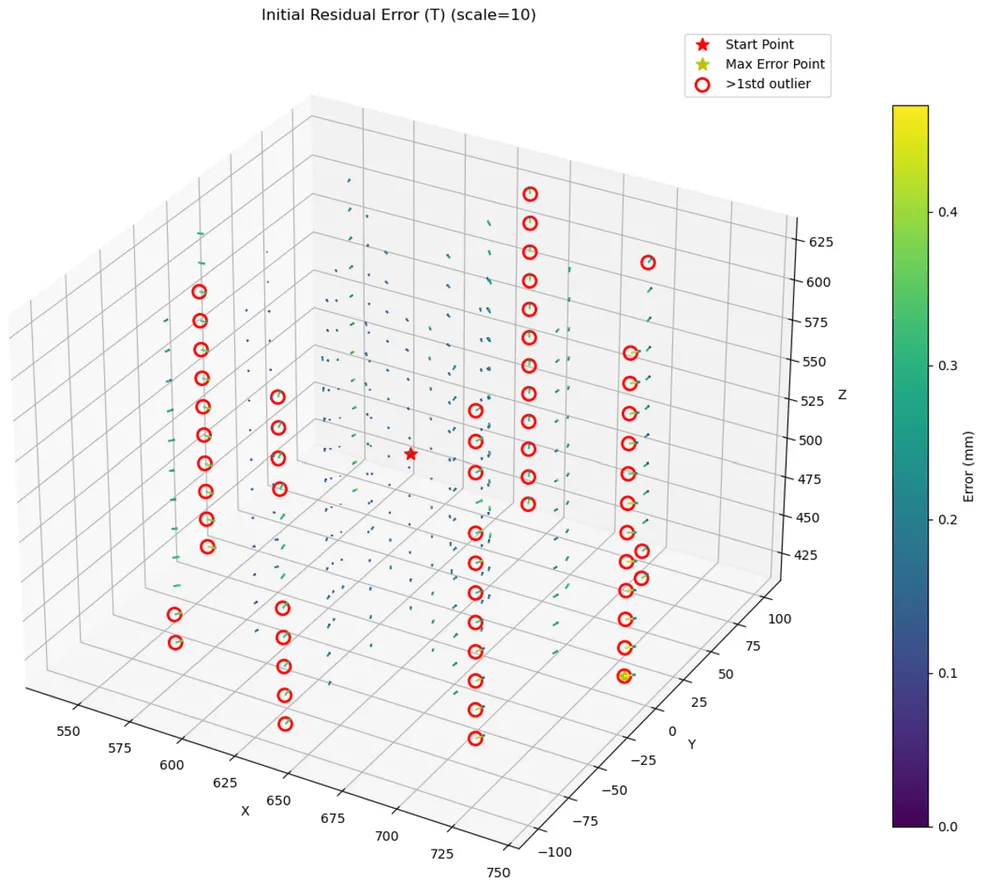
| T-only | Uncalibrated | 0.363 | 0.409 | 0.403 | 0.268 | 0.296 | 0.290 | 1.264 | 1.146 | 1.267 |
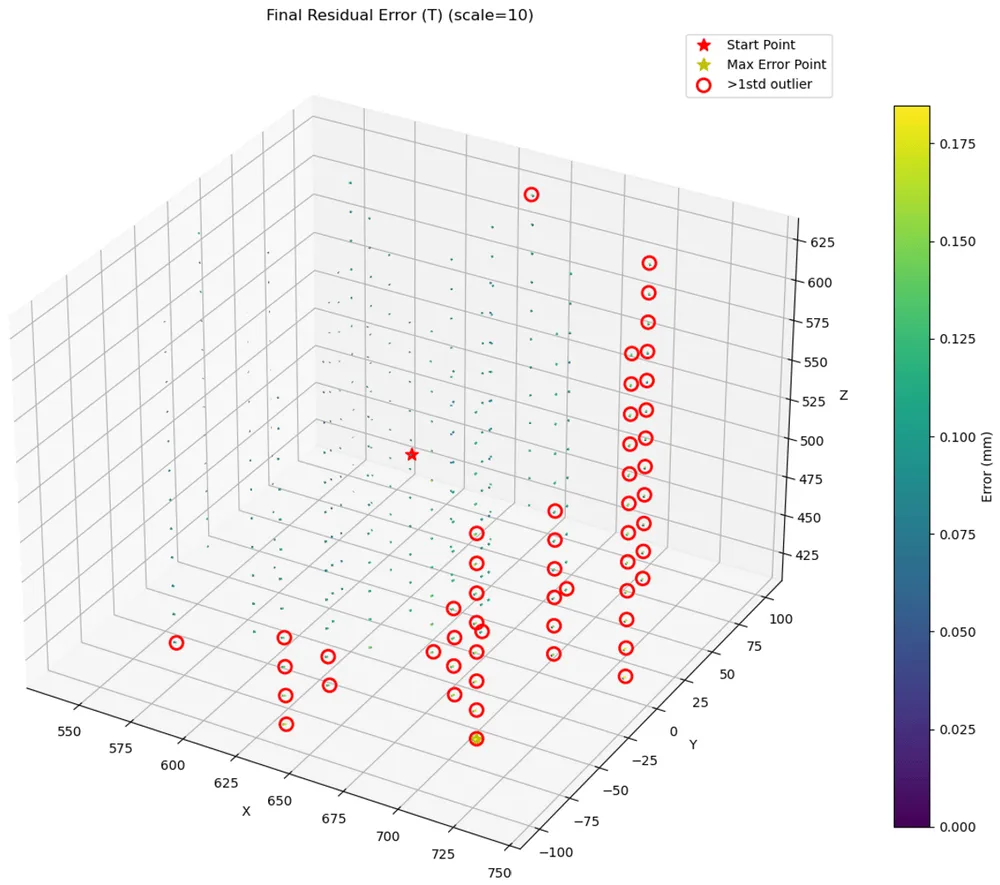
| T-only | Calibrated | 0.044 | 0.053 | 0.041 | 0.032 | 0.035 | 0.024 | 0.148 | 0.149 | 0.088 |
| R-only | Uncalibrated | 3.740 | 1.931 | 0.514 | 2.167 | 1.097 | 0.360 | 7.365 | 4.023 | 1.464 |
| R-only | Calibrated | 0.050 | 0.097 | 0.107 | 0.032 | 0.064 | 0.050 | 0.129 | 0.223 | 0.222 |
Rotation error (deg)
| Data set | State | Mean X | Mean Y | Mean Z | Std X | Std Y | Std Z | Max X | Max Y | Max Z |
|---|---|---|---|---|---|---|---|---|---|---|
| Test HE | Uncalibrated | 0.077 | 0.126 | 0.063 | 0.059 | 0.084 | 0.043 | 0.209 | 0.297 | 0.167 |
| Test HE | Calibrated | 0.012 | 0.077 | 0.045 | 0.008 | 0.025 | 0.016 | 0.026 | 0.108 | 0.070 |
| T-only | Uncalibrated | 0.015 | 0.03 | 0.04 | 0.011 | 0.024 | 0.030 | 0.046 | 0.111 | 0.125 |
| T-only | Calibrated | 0.004 | 0.077 | 0.042 | 0.000 | 0.000 | 0.000 | 0.004 | 0.077 | 0.042 |
| R-only | Uncalibrated | 0.050 | 0.069 | 0.038 | 0.042 | 0.061 | 0.031 | 0.161 | 0.257 | 0.128 |
| R-only | Calibrated | 0.008 | 0.077 | 0.044 | 0.006 | 0.019 | 0.012 | 0.026 | 0.108 | 0.070 |
Residual error
Each arrow is the residual at one point, drawn at scale 10. The color scales differ between plots, so compare them using the captions.